jx:grid
jx:grid fills a rectangular area with header values across columns and data rows downward. Perfect for pivot-style reports, dynamic-column tables, or any report where the columns aren’t known at template design time.
Syntax
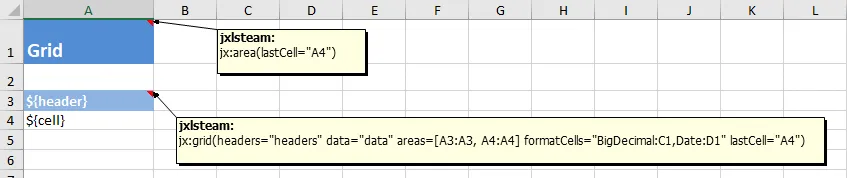
Section titled “Syntax”jx:grid(headers="headerList" data="dataRows" lastCell="A1")Attributes
Section titled “Attributes”| Attribute | Description | Required |
|---|---|---|
headers | Expression for header values (1D slice) | Yes |
data | Expression for data rows (2D slice) | Yes |
lastCell | Bottom-right cell of the grid area | Yes |
Example
Section titled “Example”Template:
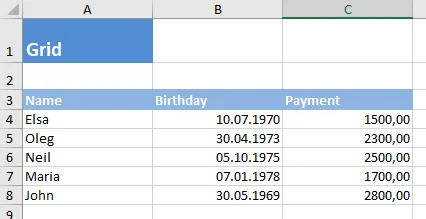
Output:
Go code:
data := map[string]any{ "headers": []string{"Q1", "Q2", "Q3", "Q4"}, "dataRows": [][]any{ {100, 200, 150, 180}, {90, 110, 130, 160}, },}Headers expand to the right. Data rows expand downward. The template cell’s formatting is applied to every generated cell.
When to use grid vs. each
Section titled “When to use grid vs. each”- Use
jx:eachwhen your columns are fixed and known at template design time (the common case) - Use
jx:gridwhen the number of columns is dynamic — the data determines how many columns appear
Common pitfalls
Section titled “Common pitfalls”- Shape mismatch. Each row in
data(the inner slice) should be the same length asheaders. Shorter rows leave blank cells; longer ones overflow past the area boundary. - Headers are a 1D slice, data is 2D.
headers: []string{"Q1","Q2"}anddata: [][]any{{1,2},{3,4}}. Easy to flip when you’re tired. - The template cell’s formatting carries to every generated cell. Bold + center-aligned in the template → bold + center in every output cell. Pick the template formatting carefully.
- Use
jx:eachfor fixed columns.jx:gridis for cases where column count is data-driven; if your columns are known, plainjx:eachis clearer.
Try it
Section titled “Try it”Download the runnable example: template t09.xlsx | output 09_grid.xlsx | code snippet
Next command
Section titled “Next command”Need to insert images into your report?